
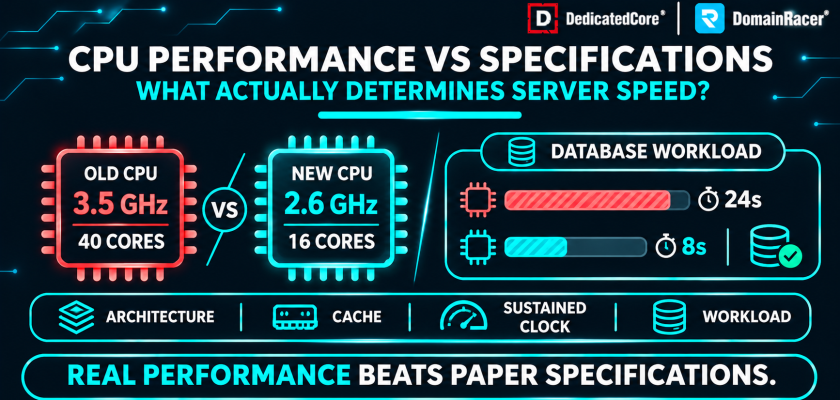
A processor rated at 5.0 GHz with 16 cores looks faster on paper than a 4.0 GHz chip with 8 cores. But which one finishes a database query faster under sustained load? Specifications are the blueprint. Performance is the result. The two diverge more often than most hosting buyers expect.
What separates a CPU that delivers from one that just reads well on a spec sheet? For dedicated server and VPS hosting buyers, the wrong CPU means wasted money on idle cores. It can also mean failure under peak traffic. A 16-core chip running a 4-thread workload leaves 12 cores doing nothing. DedicatedCore and DomainRacer test what a CPU delivers under a sustained server workload.
CPU Performance Explained: The Equation Behind Execution Time
Every evaluation at DedicatedCore starts from the Iron Law of Processor Performance:
Execution Time = (Instructions / Program) × (Clock Cycles / Instruction) × (Seconds / Clock Cycle)
- Instructions per Program reflects software and compiler efficiency. Better code sends fewer instructions to the CPU
- Clock Cycles per Instruction (CPI) is set by the CPU architecture. IPC is its inverse. Higher IPC means more work per cycle
- Seconds per Clock Cycle is the frequency in GHz. Higher GHz means each cycle completes faster
This equation shows why GHz alone misleads. A chip with high frequency but poor architecture has a high CPI. That means more clock cycles wasted per instruction. It loses to a chip with lower frequency but better IPC. A 5.0 GHz processor from 2020 can finish a task more slowly than a 3.8 GHz chip from 2025. The newer design handles more work per cycle.
DedicatedCore Forex VPS publishes frequency alongside architecture generation for every plan we sell. A GHz number without the architecture behind it is half the picture. We size every tier by measuring the workload first and matching the CPU second, using a cores versus vCPU comparison in that validation. We validate every tier so the CPU matches the workload, not the other way around.
CPU Generations Compared: How Architecture Shapes Real Speed
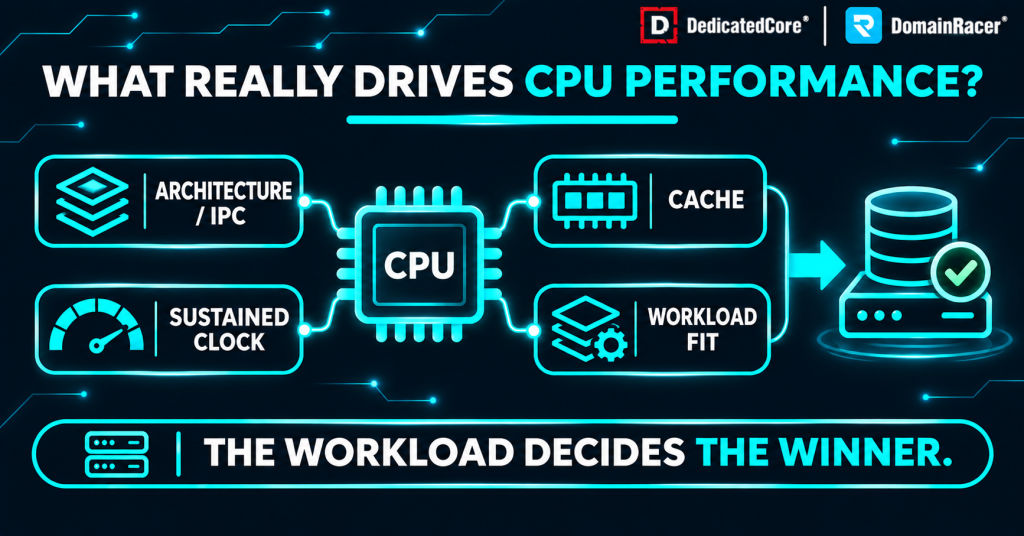
Real CPU performance depends on architecture, cache, sustained clock speed, and how well the processor matches the workload.
Architecture generation sets the baseline capacity of every CPU. It decides how much work gets done in a single clock cycle.
- Instructions per clock (IPC). Each generation improves how the core handles instructions. A 4.0 GHz chip on Intel Lion Cove beats a 5.0 GHz chip from 2020
- Branch prediction and wider execution units. Modern designs predict code paths with 97%+ accuracy and run more operations in parallel, visible in benchmarks, not GHz
- The cross-generation rule. Never compare GHz across architectures. A 3.5 GHz Zen 5 core and a 3.5 GHz Raptor Lake core deliver different IPC
We record architecture generation and measured IPC next to every CPU we select. We do not let a server enter production until its CPU passes a current-demand check against the workload it will carry, using the hardware risk signals we monitor. That check runs on a defined cycle, not just at procurement. We track every component so risk is measured from chip selection through full operational life.
Real-World CPU Benchmarks vs the Spec Sheet: What Holds Up
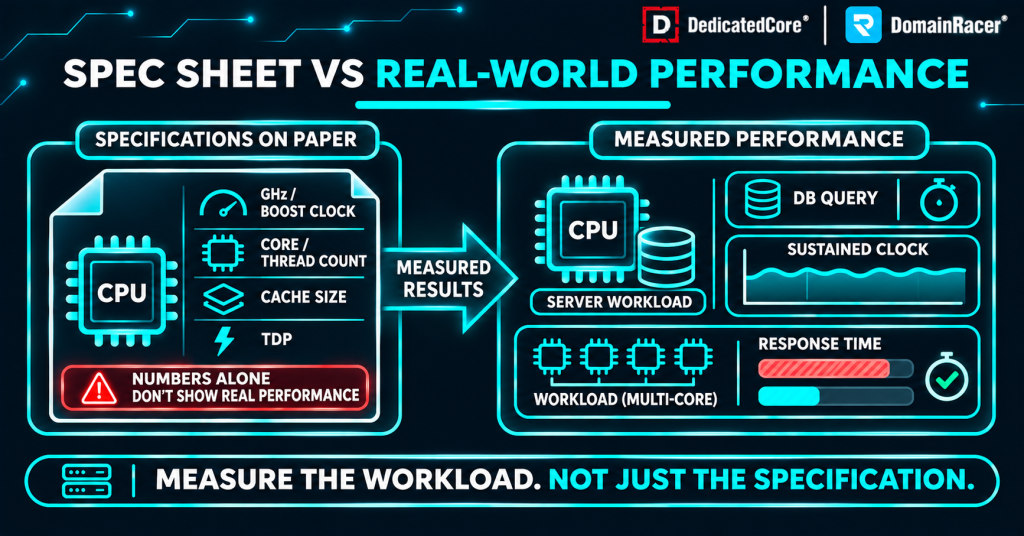
Real CPU performance is measured through workload testing, sustained clock speed, database queries, and response times—not specifications alone.
Synthetic benchmarks like Cinebench and Geekbench show the theoretical ceiling. Real-world benchmarks show task completion time under actual server conditions.
- Averages hide spikes. A CPU scoring 3,000 on Geekbench might stutter during sustained database queries. The 99th percentile response time tells the real story
- Overclocking and integrated graphics. On a dedicated server running stock configuration, neither spec matters. Both are desktop marketing points
- The date matters. Benchmark scores without the test date are misleading. A 2021 Cinebench R20 score and a 2025 Cinebench 2024 score cannot be compared
| Specification on Paper | Performance Metric That Matters | Why the Metric Wins |
| Core and thread count | Parallel thread scaling under real workload | Shows whether software uses those cores |
| Advertised boost clock | Sustained clock speed under load | Reveals what the CPU holds after the first seconds |
| Total cache size (MB) | Cache latency and hit rate | Shows whether data reaches the core fast enough |
| TDP rating (watts) | Peak package power draw | Shows actual cooling and power needs |
Benchmark data on DedicatedCore VPS plans includes the workload and test date with every result. A score without the test date and the workload behind it is a marketing number. We measure the full execution path from tick arrival to order confirmation so results are repeatable across sessions, documenting them through how performance measurements are collected so the method matters more than the headline number.
CPU Cores and Threads: When Extra Cores Add Cost, Not Speed
A 16-core CPU does not run software faster if that software only uses 4 cores. Software alignment decides whether those cores do useful work.
- Physical cores and threads. Hyper-Threading and SMT split each core into two logical threads, helping multitasking but not doubling single-thread speed
- The alignment rule. Most web apps and trading servers use a few threads, so extra cores beyond software needs add cost, not speed
- Where cores scale. PHP workers, virtualisation, video encoding and MT5 Strategy Tester all benefit from more cores
- Where cores do not help. Live EA execution on MT4, single-threaded database queries and page generation. A 2-core at 5.0 GHz beats a 4-core at 2.4 GHz here
- The software licence cost. Per-core software like SQL Server and Oracle bills by the core. A 64-core server can balloon licence costs
We size cores by workload, using CPU, RAM and disk sizing for dedicated servers. DomainRacer Forex VPS applies the same methodology on VPS hosting nodes. We walk every customer through the core-count decision because buying more cores than the software uses is wasted spend. We size every plan so the hardware fits the demand, not the other way around.
Server CPU Cache: Keeping Critical Data Close to the Cores
Cache is fast on-die memory that holds data close to the cores. Total size in megabytes tells only part of the story.
- Cache latency and hit rate. These decide whether the cache feeds the core in time. A large cache with high latency still forces the CPU to wait
- AMD 3D V-Cache. X3D processors stack massive L3 cache on the die, speeding up workloads that reuse the same data by skipping slow system RAM
- The hosting angle. Large L3 cache keeps database records and tick buffers near the cores. When queries miss cache, clock speed goes to waste
We test cache with the actual workload on each server rather than relying on the megabyte figure on the spec sheet. We measure hit rate and latency together, and check how NVMe and SSD compare, because a large cache with slow access is no better than a small one. We optimise the full data path so cache and NVMe work together from request arrival to response.
Sustained CPU Performance: What Happens After the Boost Fades
The boost clock on a spec sheet is a short burst on one core. It lasts a fraction of a second. A chip rated at 5.2 GHz boost can drop to 4.1 GHz under sustained load once thermals climb.
- TDP is not power draw. TDP measures heat output for cooling design. A 65W TDP chip can pull over 120 watts under boost profiles like Intel PL2
- Thermal throttling. Modern CPUs push clocks until 90–100°C, then cut frequency. The buyer paid for 5.2 GHz but gets 4.1 GHz under load
- The cooling result. A well-cooled mid-range chip often beats a throttled high-end chip. Sustained speed matters more than a peak number on a 24/7 server
- Platform balance. A fast CPU paired with slow RAM does not reach its potential. DDR5 and PCIe Gen 5 remove memory and NVMe bottlenecks
We test sustained clock under full load in every data center. A CPU that holds 5.2 GHz for three seconds and drops to 4.1 GHz after that is not a 5.2 GHz processor under real conditions. We track component age and thermal headroom on a defined cycle, following the server replacement schedule, so decay is caught before it reaches the customer. We retire hardware, so components leave service based on measured performance, not just calendar age.
Choosing the Right Server CPU for Every Workload Type
Matching the CPU to the workload is the core of our methodology.
- High-traffic eCommerce and web apps. High clock speed over massive core count. Eight to sixteen fast cores build pages faster than 64 slower ones
- Virtualisation and SaaS. Maximum core and thread density. VMs must not starve each other during peak hours
- Heavy database work. High L3 cache and memory bandwidth matter more than clock speed. The CPU often waits on data fetches
- Single-thread workloads. Live EA execution on a Forex VPS, game server ticks, and PHP processing. Single-core IPC decides speed here
- Multi-thread rendering. Sustained scaling of physical cores with DDR5 bandwidth. The workload uses every core, so count matters here
Our rule at DedicatedCore and DomainRacer follows the infrastructure standards we maintain on every tier: architecture first, then cores, then clock. Every tier in our lineup has a measured justification behind the CPU choice. We do not pick hardware by price and then build a plan around it. We review every tier so no plan drifts behind what the workload demands.
Older High-Core vs Newer Low-Core CPUs: The Real Speed Winner
This comparison appears in nearly every upgrade discussion. The answer depends on whether the workload scales across many threads.
- Newer low-core wins on. IPC, single-thread speed, DDR5, faster cache, power efficiency, and platform longevity
- Older high-core holds up only when. The workload scales across many threads, such as heavy virtualisation with dozens of VMs, and the used-market cost justifies higher power draw
- The honest trade-off. A 64-core EPYC from 2020 at 2.3 GHz runs more threads, but each finishes slower. For trading servers, the newer chip wins on response time
We evaluate this trade-off for every hardware refresh. We never assume that newer means faster without measuring. The before-and-after numbers on the actual workload, plus the hardware upgrade warning signs, decide whether an upgrade goes ahead or stays on hold. We approve every transition so no customer moves to new silicon without data behind the decision.
Server CPU Transparency: What Separates Hosting Providers
This table shows what dedicated server and VPS hosting buyers should check before picking a provider.
| What to Check | Typical Budget Host | Average Managed Host | DedicatedCore / DomainRacer |
| CPU model disclosed | No | Generation mentioned | Exact model published per plan |
| Clock speed stated as | Peak boost | Boost range | Sustained clock under load |
| Allocation method | Shared, 4:1–10:1 overcommit | Soft limits | KVM with dedicated cores, 1:1 |
| Architecture generation | Often 2017–2020 era | 2021–2023 | Current-generation with DDR5 |
| Benchmark access | Not permitted | Permitted | Encouraged and verifiable |
| Cache and IPC documented | No | No | Published alongside every CPU |
| Trial period | No trial | 7-day trial | 30-day trial with money-back guarantee |
DedicatedCore and DomainRacer built this comparison from buyer questions. The difference is whether the provider tests the CPU under the workload you will run.
Server CPU Selection in Practice: Real-World Case Studies
We document these cases because a spec sheet cannot show what happens under live traffic. These come from our migration records.
Case Study 1. An eCommerce store moved from 64 cores to 16 cores and got faster.
A Magento store ran on a 64-core EPYC from 2019 at 2.1 GHz. Page generation averaged 1.8 seconds during peak traffic. The store chose a high-core server, expecting better speed.
Our solution: We moved it to a 16-core Intel server from 2025 at 4.5 GHz with DDR5 and larger L3 cache. The workload used 4 to 6 threads. The rest of the old cores had been idle.
The Result: Page generation dropped from 1.8 to 0.6 seconds under the same traffic. Power use fell by 40%. The store handled Black Friday traffic without a single timeout. Network-edge protection, including how a DDoS path is blocked, carried over since that layer sits outside the CPU.
Case Study 2. A database server where cache was the bottleneck, not GHz.
A MySQL database ran on a 3.8 GHz Intel processor with 16 MB L3 cache and DDR4 RAM. Query times averaged 12 ms but spiked to 85 ms during reporting runs. The working dataset exceeded the cache.
Our solution: We moved the database to a current-generation AMD chip with 96 MB L3 cache and DDR5 at 3.6 GHz. The larger cache kept the working dataset near the cores. This cut slippage between query submission and result.
The Result: Average query time dropped from 12 ms to 4 ms. Peak spikes dropped from 85 ms to 18 ms. The lower-frequency chip with better cache won. Ongoing monitoring follows the DDoS detection checks and the network health schedule alongside CPU tracking.
Both cases came down to the same point. The spec sheet told one story. The workload told another. Testing under real traffic revealed what the numbers on paper could not show.
DedicatedCore’s Expert Answers on Server CPU Performance and Selection
We hear these questions from hosting buyers every week. The answers come from our testing methodology.
How do you compare two CPUs when their GHz and core counts look the same?
We run the same workload on both processors and measure task completion time. Two CPUs at 4.0 GHz with 8 cores can deliver 30% different results. The gap comes from IPC differences between architectures. We check the generation, cache design, and sustained clock under load.
Geekbench 6 single-core captures IPC, frequency, and cache in one number. We validate those scores against what the provider actually markets, using how a server processor is chosen in that review. A benchmark without a test date does not count. We test marketed numbers so every claim faces scrutiny before we publish it.
Why don’t you choose a dedicated server CPU based on boost clock or TDP?
We never trust boost clock or TDP as selection criteria. Boost clock is a burst rating that drops under sustained load. TDP is a thermal design figure that underreports actual power draw. A processor rated at 125W TDP can pull over 200W under boost profiles. We test sustained clock after 30 minutes of full load and measure actual power at the wall.
Real cases where marketed specs collapsed under live trading pressure are documented in the incident reviews we published, so traders see what went wrong and what the migration to tested hardware changed.
When do you recommend more cores, and when do you recommend a newer architecture instead?
We recommend more cores when the workload scales across threads. Virtualisation, rendering, and running multiple MT4/MT5 terminals on one broker account all benefit. We recommend a newer architecture when the workload is single-threaded. Live EA execution, page generation, and database queries fit here.
For Forex VPS, a scalping EA gains more from two fast dedicated cores than eight slow shared ones. Every retirement runs through the server decommissioning steps we follow, so hardware retires when a newer architecture should take its place.
Test the Workload, Not the Label
Architecture and IPC come first. Cache and sustained clock matter more than peak numbers. Core count is matched to the software, not pushed for the marketing page. Sustained performance matters more than a boost clock that drops after a few seconds. We start every CPU selection with the workload and the Iron Law equation, not the spec sheet.
DedicatedCore and DomainRacer hosting apply this equation to every plan. Current-generation processors at 4.5 to 5.7 GHz with dedicated KVM cores, zero overcommit, and DDR5 RAM. Start with a 30-day trial backed by a money-back guarantee.
